How much should you spend? Computing the Pareto frontier between budget and success
Every real plan has at least one money question hiding in it. Hire the editor or edit it yourself? Lean launch or paid promotion? Three months of runway committed, or six? Planning tools almost universally treat these as out of scope: the budget is a number in a field somewhere, and the plan is the same plan whether you spend half of it or twice it.
That is a strange place to draw the boundary, because the money decision usually changes the plan's odds more than any scheduling decision does. Spend more and certain outcomes become more likely; spend less and you keep cash but accept risk. The relationship between the two is not a vibe, it is a curve, and you can compute it.
Decisions are a different kind of node#
The first step is to be precise about what a decision is. A plan contains two kinds of uncertainty:
- Outcomes are uncertainties the world resolves: does the review pass, does the deal close. You can estimate them; you cannot choose them.
- Decisions are uncertainties you resolve: which tier, how much runway, build or buy. You can choose them; the question is what each choice buys.
Most tools only model the first kind, implicitly, in someone's head. TOL, Topolog's planning language, makes both explicit. A decision is declared with its type and its option space:
decisions { gtm: enum[lean, balanced, aggressive] }On its own, a decision does nothing. It gets its power from two couplings. First, each option can scale costs: an aggressive go-to-market spends more on the same tasks. Second, and this is the important one, each option can move an outcome's prior:
outcome pmf_strong: boolean {
  default_prior: 0.45                                  // lean GTM
  conditional_overrides: [
    { when: gtm = balanced;   apply: { default_prior: 0.65 } }
    { when: gtm = aggressive; apply: { default_prior: 0.85 } }
  ]
}
Read it plainly: with a lean launch, strong product-market fit has a 45% prior; a balanced spend lifts it to 65%; an aggressive one to 85%. The numbers are yours to own (or to let the AI draft and then argue with), but once they are written down, spend and success are mechanically connected. Choosing a tier is no longer a label on a spreadsheet tab. It changes the forecast.
Sweeping the decision space#
With decisions declared, the engine can do something no hand-built spreadsheet scenario tab does well: evaluate all of it. The Pareto sweep enumerates every combination of decision values (continuous decisions like a budget range get discretised onto a grid, enumerated options multiply), and for each cell it runs the full pipeline: patch the outcome priors for that cell's decision values, scale the costs, run the Monte Carlo forecast, and read off every declared objective.
Objectives are declared in the plan too, and they are arbitrary in the useful sense: you pick which quantities the sweep should trade off. Cash drawdown, end balance, profit, probability of insolvency, total cost, plan duration, probability of success:
pareto {
  minimize: account.balance.trajectory.drawdown
  maximize: account.balance.trajectory.last
}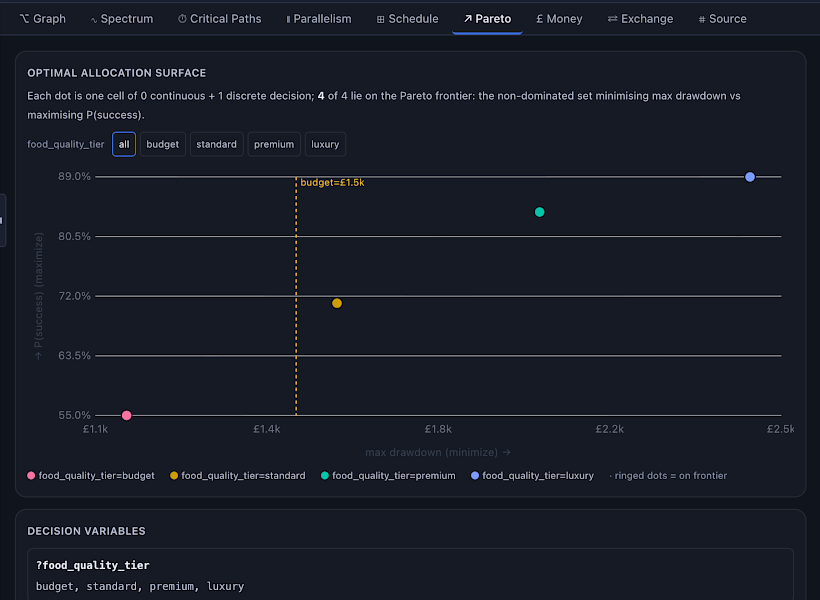
The result is a scatter: one point per decision combination, positioned by its objective values. Most points are strictly worse than some other point and can be ignored. The interesting set is the Pareto frontier: the points where you cannot improve one objective without giving up another. That frontier is the actual shape of your money question.
One engineering detail matters enough to mention. Every cell in the sweep is evaluated with the same random numbers (the technique is called common random numbers). If two cells differ, it is because the decisions differ, not because one cell got unlucky dice. Scenario comparisons in most tools quietly fail this test; here the frontier is a property of the plan, not of the noise.
Reading the curve#
Plot drawdown against probability of success along the frontier and the curve does the explaining:
| Region of the frontier | What it is telling you |
|---|---|
| Steep | Money is buying odds here. A small extra commitment moves P(success) a lot. Underspending in this region is the expensive mistake. |
| Flat | Diminishing returns. Extra spend moves the odds barely at all; you are paying for comfort, not probability. |
| The knee | The natural operating point for most risk appetites: the last point where spend still buys meaningful probability. |
There is no single right answer on a frontier, which is precisely the point. A bootstrapped founder and a funded one should pick different points on the same curve. The tool's job is to compute the curve honestly; choosing where to sit on it is a judgement about your own appetite for risk, made visible instead of implicit.
When you do choose, the choice feeds back. Committing a decision collapses the swept space: the frontier re-renders around the world you actually picked, and the plan's forecast, schedule, and cash trajectory all condition on it.
The cash side of the story#
Because the sweep runs the full engine, every point also carries a complete money simulation: a balance trajectory with uncertainty bands, worst-moment drawdown, end balance, and the probability the balance ever crosses zero. A plan can even gate its end states on the bank balance, so "success" structurally requires staying solvent, not just finishing tasks. That deserves its own article; the short version is that a plan which runs out of cash four samples in five should not be allowed to report itself as 90% likely to succeed.
The mechanics of accounts, costs, and revenue are in the money docs, and the frontier itself in the Pareto docs.
The honest caveats#
The frontier is only as good as the couplings. If aggressive does not really lift your odds to 85%, the curve will faithfully reproduce your optimism. The defence is the same as for any estimate: write the number down where it can be seen and argued with, compare forecasts to actuals over time, and prefer ranges you would bet on to numbers that look impressive. And small decision spaces are fine: one three-option decision already produces a frontier worth staring at. You do not need an enterprise scenario office; you need your one real money question stated as a decision instead of a worry.
Budgets make poor walls. They make excellent levers, once you can see what the lever is attached to.