P(insolvency): forecasting whether your project runs out of cash before it ships
Projects rarely die because the work was impossible. They die because the money ran out while the work was still possible. Yet open any mainstream planning tool and look for the number that matters most to a founder, an agency owner, or anyone funding work out of a finite pot: the probability that the balance crosses zero before the plan completes. It is not there. Budget is a field, sometimes a burndown bar. The risk is nowhere.
The omission is odd, because the computation is not exotic. If you can simulate when work happens (and a Monte Carlo schedule engine does exactly that), you can simulate what it costs and what it earns as it happens. Cash position is just another quantity riding along each simulated future.
A bank account inside the plan#
In TOL, money lives in the plan as an Account with a starting balance:
deliverable_registry {
  Account {
    chained_type: chain
    initial_balance: 20000
    properties { balance: money = 20000gbp }
    initial_instances: 1 { }
  }
}
Tasks can carry costs (uncertain ones, like durations: a cost has a centre and a spread). Revenue is an effect: completing a task can credit the account, and the credit can be gated on an outcome, so "the deal pays out" only happens in the futures where the deal actually closes. The full syntax is in the money docs; the conceptual move is the important part. Spending and earning are attached to the work that causes them, not tracked in a parallel spreadsheet that drifts from the plan.
What the simulation does with it#
Each Monte Carlo sample walks the plan as usual: durations drawn from their distributions, gates resolved, tasks completing in dependency order. As it walks, it replays the ledger: each completed task debits its sampled cost at the moment it finishes, each revenue effect credits, and the running balance traces a path through time. One sample is one possible financial life of the project.
Thousands of samples give you the cash picture as a distribution, summarised by a handful of numbers that do real decision work:
| Metric | The question it answers |
|---|---|
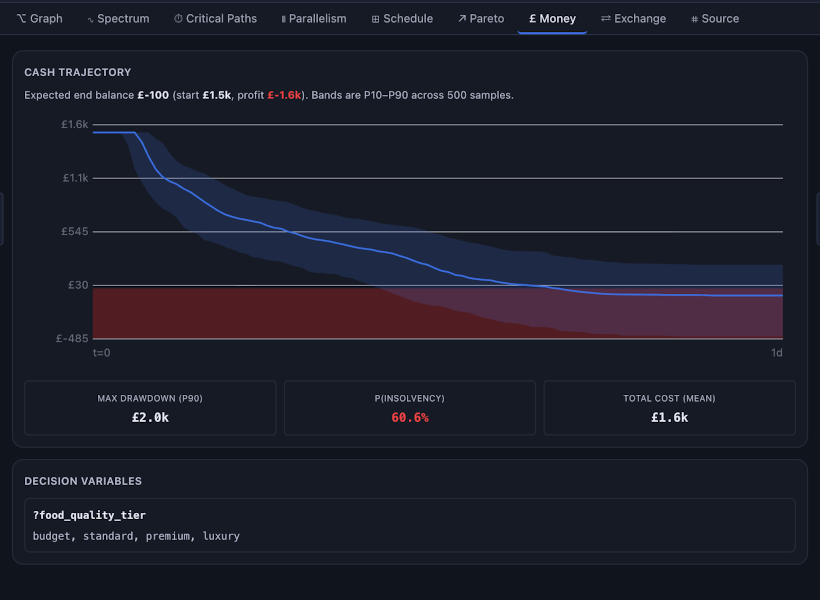
| Balance trajectory (P10/P50/P90 bands) | What does the cash curve look like in a good, typical, and bad future? |
| Max drawdown | How deep is the worst dip below the starting balance? (Your true funding requirement, which is not the same as your budget.) |
| End balance | Where does a typical future leave the account? |
| P(insolvency) | In what fraction of futures does the balance ever cross zero? |
The last one is the headline. P(insolvency) compresses every interacting uncertainty (slow tasks burn longer, late revenue arrives later, the unlucky combination of both) into one number you can govern by. "We ship in May" and "there is an 11% chance we run out of cash in March" are very different briefings, and only one of them is visible in a Gantt chart.
Drawdown deserves a special mention because it routinely surprises. A plan can end comfortably in the black and still spend a terrifying week at minus four thousand pounds in its middle, where costs front-load and revenue back-loads. The P90 drawdown is the number to size a buffer against; the end balance tells you nothing about the journey.
Timing is most of the story#
Notice what made this possible: the schedule and the ledger are the same simulation. Cash risk is overwhelmingly a timing phenomenon, the race between burn and income, and a tool that models money without modelling when (or whether) work completes can only do arithmetic, not risk. This is also why the cash picture updates when anything in the plan changes. Re-estimate a task, cut a milestone, or watch real progress come in slower than hoped, and the trajectory, drawdown, and P(insolvency) recompute with the schedule, because they were never separate from it.
Two natural next steps follow from having the cash distribution. You can make solvency a condition of success itself, gating the plan's end states on the simulated balance, so a future that runs out of money counts as a failure no matter how the tasks went; that is the earned forecast. And you can treat spend as a lever rather than a fact, sweeping budget decisions against the odds they buy; that is the Pareto frontier.
The honest caveats are the usual ones. The output is only as good as the cost and revenue assumptions you write down, and a probability of insolvency computed from optimistic inputs is optimism with decimal places. Write ranges you would defend, let actuals correct you, and treat the trajectory as an instrument reading, not a guarantee. But have the instrument. Flying with a fuel gauge does not make the tank bigger; it changes every decision about the route.