Why your project deadline should be a probability distribution, not a date
Ask a typical planning tool when your project will finish and it gives you a date. Ask an engineer when the build will be done and you get "Thursday, probably". The engineer is being more honest than the tool.
A date is a single number summarising something that is not a single number. Every task estimate is uncertain, uncertainty compounds along dependency chains, and a gate that can go either way ("does the review pass?") splits the future into branches with different endings. The honest answer to "when will this finish?" is a distribution: a range of dates, each with a probability, split by how the project can end.
This article shows what that looks like in practice, with real output from Topolog's forecasting engine, and how to read it.
The toy plan#
Here is a small plan in TOL, Topolog's planning language. One person launching an online course: outline it, then record lessons and build the landing page (both depend on the outline), then a final review. The review produces a boolean outcome, approved, with a prior of 0.8. If it fails, the launch is held back for rework.
plan "Course launch" {
  agent me { type: internal }

  outcome approved: boolean { default_prior: 0.8 }

  task t_outline "Outline the course" { agent: me; estimate: 8h cv 0.3 }
  task t_record "Record the lessons" { agent: me; estimate: 20h cv 0.5 }
  task t_site "Build the landing page" { agent: me; estimate: 12h cv 0.4 }
  task t_review "Final review pass" {
    agent: me
    estimate: 4h cv 0.3
    produces: [approved]
  }

  sentinel s_live "Course is live" { end_state: success }
  sentinel s_rework "Held back for rework" { end_state: partial }

  edge e1 t_outline -> t_record { carries: null }
  edge e2 t_outline -> t_site { carries: null }
  edge e3 t_record -> t_review { carries: null }
  edge e4 t_site -> t_review { carries: null }
  edge e5 t_review -> s_live { carries: null; gate: approved = true }
  edge e6 t_review -> s_rework { carries: null; gate: approved = false }
}
Two things to notice. Every estimate carries a cv, a coefficient of variation: "20h cv 0.5" means about 20 hours, with the kind of spread where a bad week doubles it. And the plan does not end in a checkbox. It ends in sentinels: terminal states tagged success or partial, reached through gates on a real outcome.
Add up the point estimates and you get 44 hours. That is the number most tools would print.
What the engine says instead#
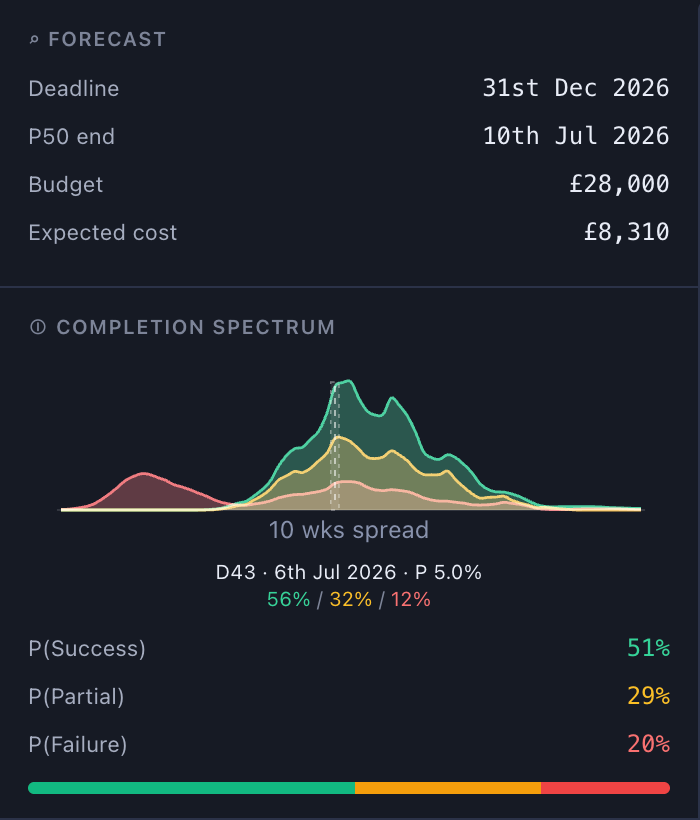
Run this plan through the Monte Carlo engine (8,000 samples, seeded so you can reproduce it) and you get a completion spectrum, not a date:
| Quantile | Hours of work |
|---|---|
| P10 | 31.3 |
| P50 (median) | 42.0 |
| P80 | 52.3 |
| P95 | 64.8 |
And the end-state split:
| Ending | Probability |
|---|---|
| Course is live (success) | 80.1% |
| Held back for rework (partial) | 19.9% |
Read the two tables together and the story changes completely:
-
The median roughly agrees with the naive sum. P50 is 42 hours against the 44-hour estimate total. If you only ever compare medians to estimates, the forecast looks boring. That is exactly why single dates survive: on an average day they are not obviously wrong.
-
The tail is where the truth lives. There is a 1-in-5 chance this takes more than 52 hours, and a 1-in-20 chance it takes more than 65, roughly 1.5 times the estimate. Nothing went "wrong" in those samples. No scope was added. That spread is already implied by the per-task uncertainty you wrote down; the engine just refuses to hide it.
-
One in five futures does not end in a launch at all. The 0.8 prior on
approvedflows straight through to the end states. A tool that prints "done by Thursday" has silently assumed the review passes.
One more honest detail: the lessons and the landing page are parallel in the graph, but the forecast does not pretend they happen simultaneously. There is one human in this plan, and one human is a serial resource. Tools that draw two overlapping bars for one person are drawing fiction; the engine schedules your work the way you will actually live it.
How to use a distribution#
A distribution is not just more honest, it is more useful, because different decisions need different quantiles:
- Internal target? Use the P50. Half your futures beat it.
- Commitment to someone else? Quote the P80 or P95 depending on the cost of being wrong. "I will ship by the P95" is a promise you keep 19 times out of 20.
- Deciding whether to take the project on at all? Look at the end-state split before any date. A 20% rework branch might matter more than a week of schedule.
The gap between P50 and P95 is itself a signal. When it is narrow, your plan is well understood. When it is wide, the plan is telling you where to spend effort: tighten the riskiest estimates, or restructure so fewer things sit on the critical chain. (We wrote about reading risk off plan structure in the critical path docs.)
Where the numbers come from#
There is no magic and, importantly, no AI in this part of the product. Task durations are sampled from lognormal distributions (long-tailed, never negative, the standard family for activity durations in the literature). Outcomes are sampled from their priors. Each sample walks the dependency graph in topological order, respects gates, and records when and how the plan ended. Do that 8,000 times and the histogram of endings is the forecast. The whole thing is deterministic given a seed: same plan, same seed, same spectrum, byte for byte.
Because the forecast is computed from the plan's structure, it updates the moment the structure changes. Re-estimate a task, add a dependency, or mark work done, and the spectrum shifts. As you complete real work, recorded completion times feed back into the model, so the forecast calibrates to how you actually work rather than how you hoped you would.
If you want the full mechanics, the completion spectrum docs go deeper, and the entire planning language is public in the TOL handbook, so you can paste the plan above into the IDE and watch the same numbers come out.
A date answers "when?". A distribution answers "when, how likely, and ending how?". Once you have seen the second answer, the first one looks like what it always was: a guess with the error bars torn off.