Critical and near-critical paths: the risks your Gantt chart hides
The critical path is the oldest idea in formal project management: the longest dependency chain through the plan, the sequence of tasks with zero slack, the set of places where a one-day slip costs the project a day. Knowing it is the difference between managing the schedule and managing a feeling about the schedule.
But the classic treatment has a blind spot that has burned every project manager at least once. The critical path is computed from estimates, and estimates are uncertain. A chain that is two days shorter than the critical path on paper is two days from being the critical path in reality, and "two days" is well within one task's bad week. The plan's real risk is not a path. It is a population of paths, weighted by probability.
Slack is a probabilistic quantity#
Treat each task's duration as a distribution rather than a number (the ranges article covers why) and run the plan thousands of times, and something instructive happens: different samples have different critical paths. In one simulated future the build chain sets the pace; in another, the chain through legal review, nominally three days of slack, eats its slack and takes over.
The Monte Carlo engine counts exactly this. Over all samples, each chain has a criticality rate: the fraction of futures in which it was the thing setting the finish date. That number is strictly more useful than the binary critical/not-critical label:
| Paper view | Probabilistic view | What it means for you |
|---|---|---|
| The critical path | Critical in 55% of futures | Manage it, but it is not the whole story |
| 2 days of slack | Critical in 30% of futures | A near-critical path: one slip from mattering |
| 9 days of slack | Critical in under 2% of futures | Genuine slack; stop watching it |
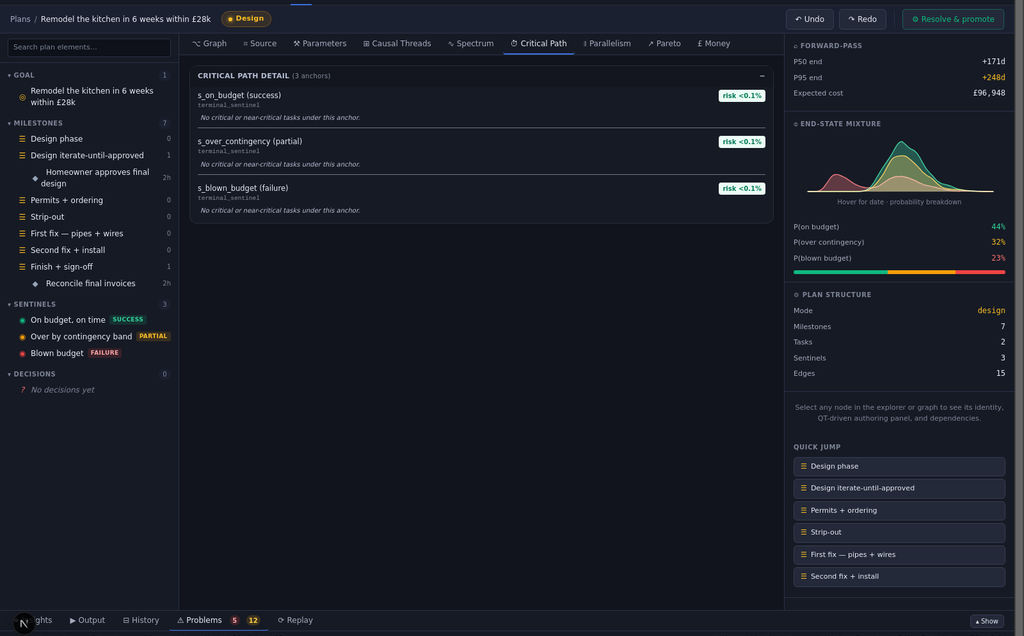
The near-critical band is where projects are actually lost, precisely because nobody is staring at it. The headline chain gets the attention, the daily questions, the best people. The chain that is 30% likely to take over gets none of that, right up until it does, at which point the slip arrives as a surprise from a direction nobody was facing. Topolog's critical path view renders both: the modal path highlighted, the near-critical contenders ranked by how often they seize the lead.
Asking the inverse question#
Criticality also answers the planning question that matters on the way in, not just the way through: if we could accelerate one task, which one would actually move the finish date?
The naive answer is "anything on the critical path", and it is wrong in an expensive way. Accelerating a task that is critical in 55% of futures buys you nothing in the other 45%. The better metric weighs both how often a task is on the deciding chain and how much of the spread it contributes. A short task that is critical in every future can matter less than a wildly uncertain task that is critical in half of them. This is dependency-aware planning in the useful sense: not drawing the arrows, but computing what the arrows imply about where effort pays.
The same logic runs in reverse for de-scoping. Cutting a task that lives on a 2%-critical chain changes your finish date by approximately nothing, however large the task looks in the work breakdown. The graph, not the task list, knows which cuts are real (what-if edits make checking this a ten-second exercise).
You do not need to be a planner to use this#
A fair objection to classical critical path method was always that it demanded expertise: maintain the network diagram, run the forward and backward passes, keep the float calculations honest. Nobody outside aerospace did, so the critical path lived in textbooks while real teams eyeballed Gantt bars.
The structural fix is that the path computation should be a by-product, not a discipline. In Topolog the plan is already a dependency graph (that is the whole premise), the engine already samples it thousands of times for the forecast, and criticality rates fall out of those same samples for free. There is nothing to maintain and no methodology to learn: the critical path tab is just another lens over the object you already have, and it stays current with every edit and every completed task because it is recomputed, not redrawn.
The mental upgrade is the lasting part. Once you have seen criticality as a percentage, the question "what is our critical path?" starts sounding like "what is our weather?". The useful version was always "what might it be next week, and how confident are we?". Plans, like weather, deserve forecasts rather than verdicts.