A Gantt chart, a Kanban board, and a to-do list are the same object
Every team eventually maintains three artefacts that describe the same work: a Gantt chart for the timeline review, a Kanban board for the daily stand-up, and somebody's to-do list for actually getting things done. And every team eventually has the meeting where the three disagree: the board says a task is in progress, the chart says it finished last week, and the list does not mention it at all.
The disagreement is not a discipline problem. It is an architecture problem. Each artefact is maintained by hand, so each one drifts independently. The fix is not more discipline; it is recognising that all three are views of a single underlying object, and storing that object instead.
The object underneath#
Strip the visuals away and ask what each artefact actually encodes:
- A to-do list is an ordering: do this before that.
- A Kanban board is a partition by status: not started, in progress, done.
- A Gantt chart is a mapping from tasks to time, constrained by dependencies.
All three are derivable from one structure: a set of tasks plus the dependency relationships between them, that is, a directed acyclic graph (DAG). Tasks are nodes. "B needs A finished first" is an edge. Acyclic because work cannot transitively depend on its own completion.
Once the DAG is the stored object, each classic view falls out as a computation rather than a document:
| View | The computation that produces it |
|---|---|
| To-do list | A topological sort of the graph: any linear order that respects every edge. The "what can I do right now?" list is the ready frontier, the nodes whose predecessors are all done. |
| Kanban board | A partition of nodes by execution state, with one twist: "blocked" is computed from the graph, not asserted by a human. A task is blocked exactly when an unfinished predecessor exists. |
| Gantt chart | A projection onto the time axis: walk the graph in dependency order, place each task at the earliest moment its predecessors and its owner's availability allow. |
Topolog is named after the first of these computations, the topological sort. It is the algorithm that turns "a web of dependencies" into "a sequence a human can execute", and it is the bridge between how plans are structured and how days are lived.
Why derived views cannot disagree#
When the views are projections, consistency stops being a process goal and becomes a mathematical property. Mark a task done and:
- it leaves the to-do list, and its newly unblocked successors join the ready frontier;
- it moves to the done column, and any successor whose last blocker it was flips from blocked to ready;
- the schedule recomputes, and every downstream bar shifts to its new earliest position.
Nobody updated three artefacts. One edit happened to one object, and three projections re-rendered. The views cannot drift for the same reason a spreadsheet cell cannot disagree with the formula that computes it.
There is a quieter benefit too: each view can be honest about what it does not know. A hand-drawn Gantt bar asserts a start date as fact. A computed one is explicit about being conditional: this is the earliest position given today's graph, today's availability, and today's progress. When reality changes, the bar moves, and that is a feature. The bar was never a promise; the graph was the promise.
What this looks like in practice#
In Topolog, the stored object is a plan written in TOL, a small declarative language where the graph is explicit:
plan "Feature release" {
agent dev { type: internal }
task t_design "Design the API" { agent: dev; estimate: 6h cv 0.3 }
task t_build "Implement it" { agent: dev; estimate: 16h cv 0.5 }
task t_docs "Write the docs" { agent: dev; estimate: 4h cv 0.4 }
task t_ship "Release + announce" { agent: dev; estimate: 2h cv 0.2 }
sentinel s_done "Released" { end_state: success }
edge e1 t_design -> t_build { carries: null }
edge e2 t_design -> t_docs { carries: null }
edge e3 t_build -> t_ship { carries: null }
edge e4 t_docs -> t_ship { carries: null }
edge e5 t_ship -> s_done { carries: null }
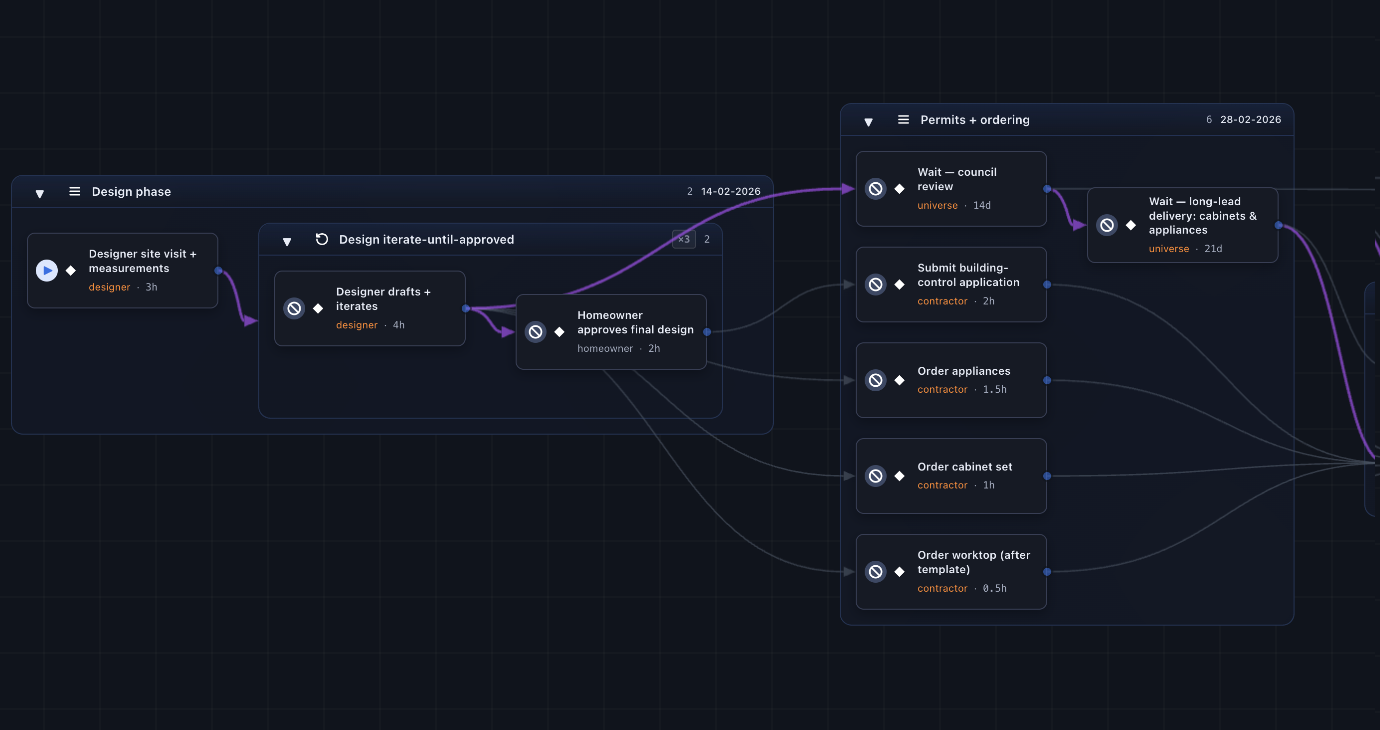
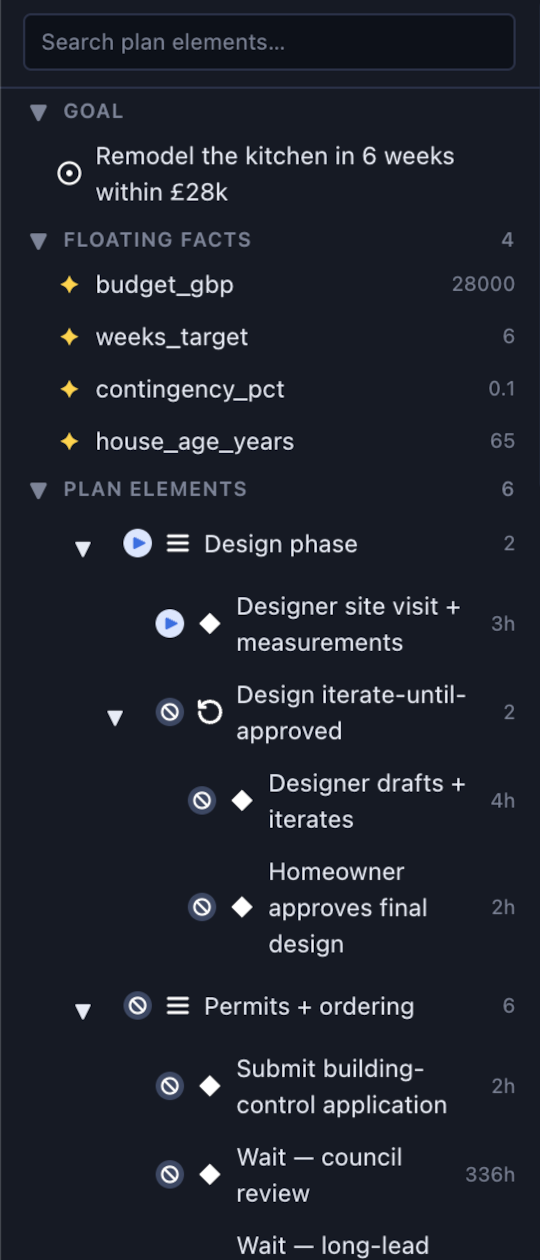
}From this one source, the product renders a dependency graph you can edit visually, a per-person timeline of causal threads, and an execute view that is exactly the ready-frontier to-do list: today it shows t_design; finish it and the frontier becomes t_build and t_docs.
Because the object is a graph rather than a picture of a graph, the engine can also answer questions no hand-maintained artefact can: what is the critical path, what is the probability distribution over finish dates, what happens to the timeline if this one task slips. (That last family of questions is the subject of the spectrum article.)
The catch, stated honestly#
This only works if your work actually forms a DAG: discrete tasks, with identifiable dependencies, and no genuine cycles. Most project work fits, but not all of it. Iterative loops ("revise until the client approves") look like cycles, and they need a dedicated construct rather than a back edge; TOL models them as bounded iterations, which keeps the graph acyclic while letting the forecast treat the loop length as the random variable it really is. And truly amorphous work ("think about strategy") resists decomposition into nodes at all. A graph-based tool is the wrong place to manage your reading pile.
But if you have ever updated the same status in three places, or sat in the meeting where the board and the chart told different stories, the diagnosis is worth taking seriously. You do not have three planning problems. You have one object and three stale drawings of it. Store the object.