
Money
Some plans are just “finish by Friday”. Others cost money: staff hours, supplier invoices, marketing spend. Topolog tracks both. The Money panel surfaces cumulative spend across the lifetime of the plan and shows you the trade-offs when money is one of the levers you’re moving.
How tasks become money
Every task can carry an optional cost. Three sources:
- Agent rate × estimated duration. An agent declared with an hourly rate generates a derived cost for every task assigned to them. The cost picks up the same uncertainty as the duration: high CV on the duration gives you a wide cost band.
- Explicit task cost. A supplier invoice or a one-off fee is declared directly on the task. No agent rate maths involved.
- Outcome-driven cost. Costs gated on outcomes (“if soft launch goes poorly, we re-do the run for £2,000 more”) are folded into the spectrum as a stochastic line item.
The cumulative-spend curve
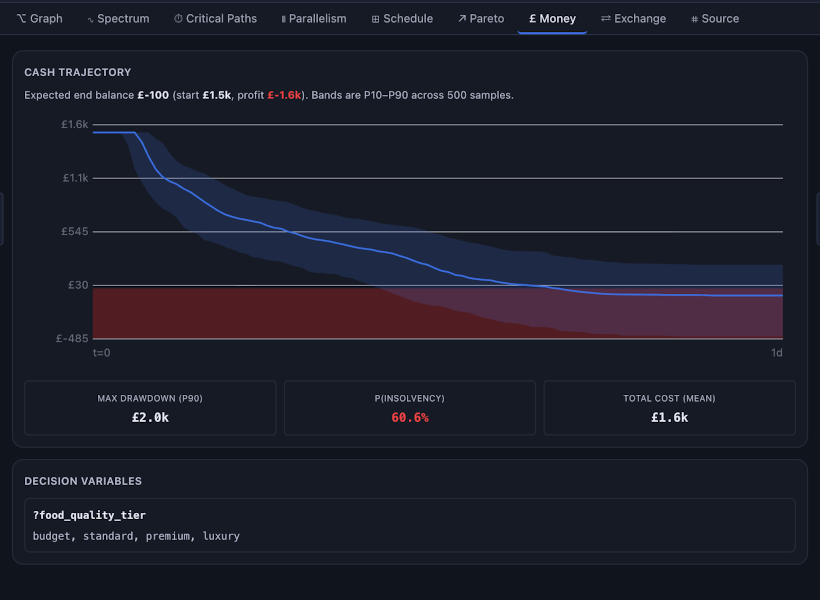
The Money panel’s headline visual is a cumulative-spend curve over time. The y-axis is total money committed; the x-axis is plan-time. Steep regions are spend-heavy weeks; flat regions are the cheap weeks where the plan is mostly waiting on external work.
Two bands wrap the curve: a 10th-percentile lower bound and a 90th-percentile upper bound. The bands come from the same monte-carlo run that produces the spectrum, so cost and duration uncertainty are correlated correctly: a plan that slips also costs more, and the cost band reflects that.
Allocation changes the outcome
Money isn’t just a cost to track - how you spend it changes whether the plan succeeds. When you build a plan with a budget, Topolog allocates that budget across the tasks and authors an allocation decision (a scope or quality tier, a build-vs-buy choice) coupled to the plan’s success outcome: the higher-investment option raises the probability of a successful finish, the lean option saves cash but lowers it.
That coupling is live in the simulation, not a label - the forward pass re-runs the outcome odds for each allocation. The Pareto tab then plots the whole trade-off: for every level of spend, the best probability of success you can buy, so you can pick the point on the curve that fits your appetite for risk.
Money on the canvas
Selecting a task with a non-zero cost shows the cost in the inspector pane on the right. Selecting a milestone shows the sum of every cost under it. Hovering a coloured-by-cost edge in the graph view shows the dependency’s contribution to the overall budget. The Money tab is the analytical view; the inspector is the spot-check.
Trade-offs the Money panel surfaces
- Time vs. money. A near-critical task with a cheaper-but-slower agent option versus a faster-but-pricier one. The Money panel shows you both costs side-by-side while the Critical Path tab shows you the duration delta. Most decisions become obvious when you can see both numbers.
- Budget overruns under uncertainty. If the 90th-percentile cost band crosses your budget cap, the panel highlights the point in plan-time where it crosses. The tasks contributing the most variance get flagged.
- Gated cost branches. When a gated outcome carries a meaningful cost difference, the panel shows the fork as two stacked bands: “here’s the expected spend curve, here’s how it diverges if the gate goes the other way.”
When you can skip it
If your plan has no agent rates and no explicit task costs, the Money panel is empty by design; it doesn’t invent numbers. Personal goals (“learn rust”, “buy a house”) usually live entirely without it. Production plans (“launch the pop-up”, “ship the v2”) lean on it heavily.
Related
- The scheduler - how money interacts with deadline propagation.
- Spectrum - the duration distribution that the Money bands are correlated against.
- Pareto - the spend-vs-success frontier built from this money model.