One plan, many lenses: spectrum, threads, money, Pareto, and the graph itself
There is a question every planning tool has to answer and most answer badly: who is the plan for? The manager wants a roadmap with phases and risk. The contributor wants to know what to do today. Finance wants the burn and the runway. The strategist wants to know which choice to make. Build for one audience and you alienate the rest; build tabs for everyone and, in most tools, each tab is a separately maintained document that drifts from the others.
The drift is the giveaway that the architecture is wrong. Those audiences are not asking for different plans. They are asking different questions about the same plan, and the fix is the one the projections article establishes for Gantt, Kanban, and the to-do list: store one object, compute every view. Topolog's IDE takes that idea to its conclusion with nine tabs over a single TOL program. Three deserve a closer look because they answer the three hardest questions.
The Spectrum: "when, and how does it end?"#
The forecast view. The Monte Carlo engine runs the plan thousands of times and the spectrum is the histogram of endings: completion dates smeared into a distribution, split by terminal state, so you read "P80 in mid-May, 81% success, 19% rework" off one picture (how to read one). This is the manager's and the client's lens, and it is computed, never asserted: nobody updates the forecast, because the forecast is what the plan implies.
Causal Threads: "what does this mean for my week?"#
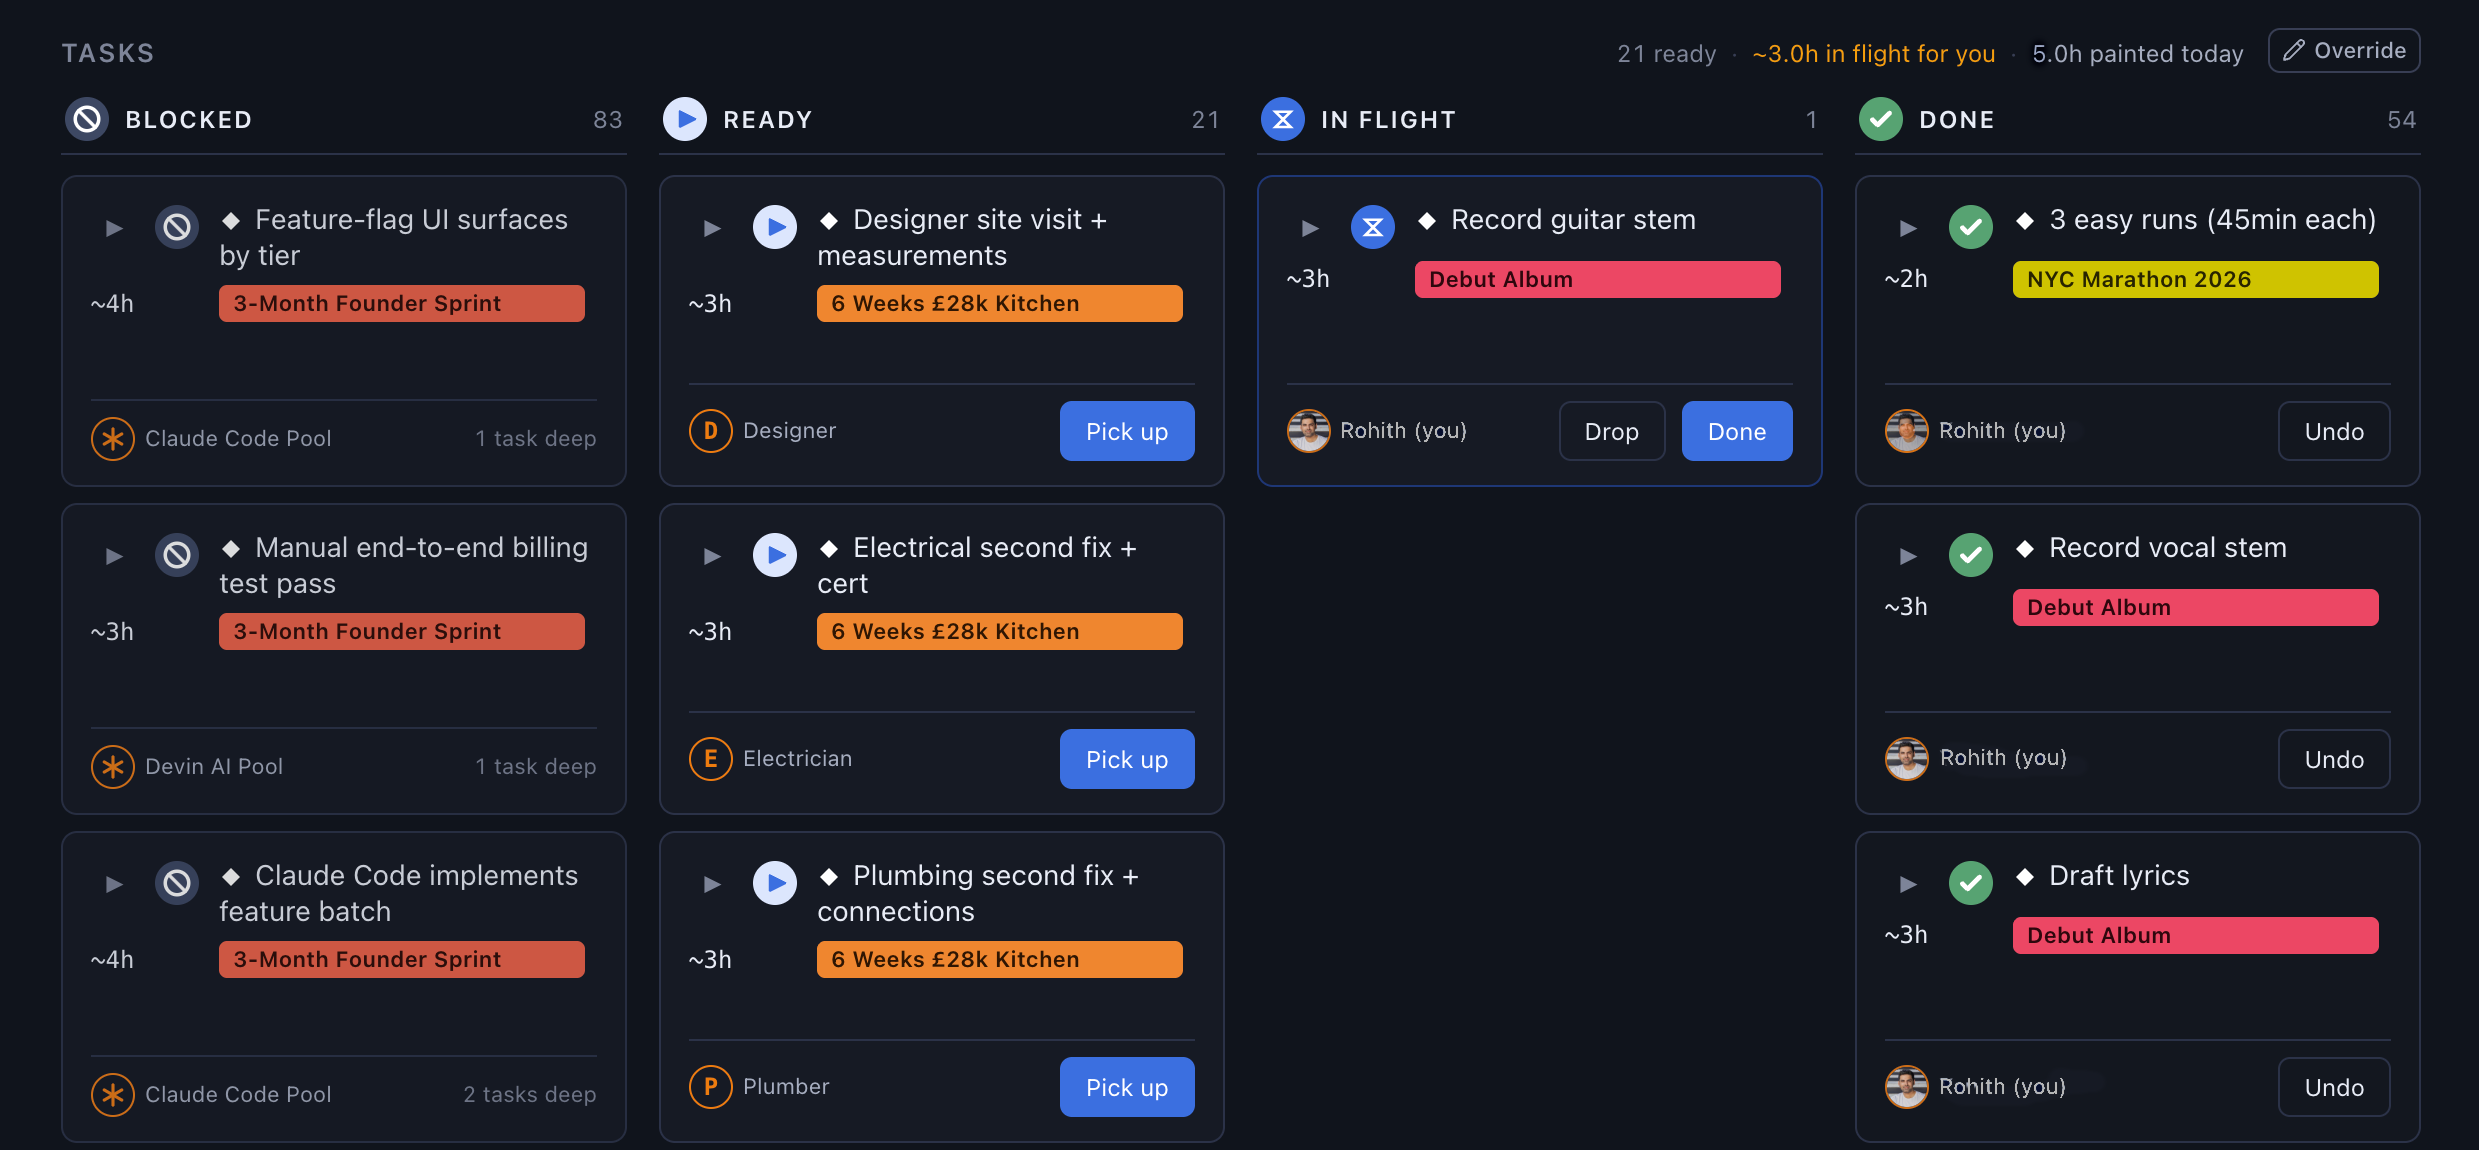
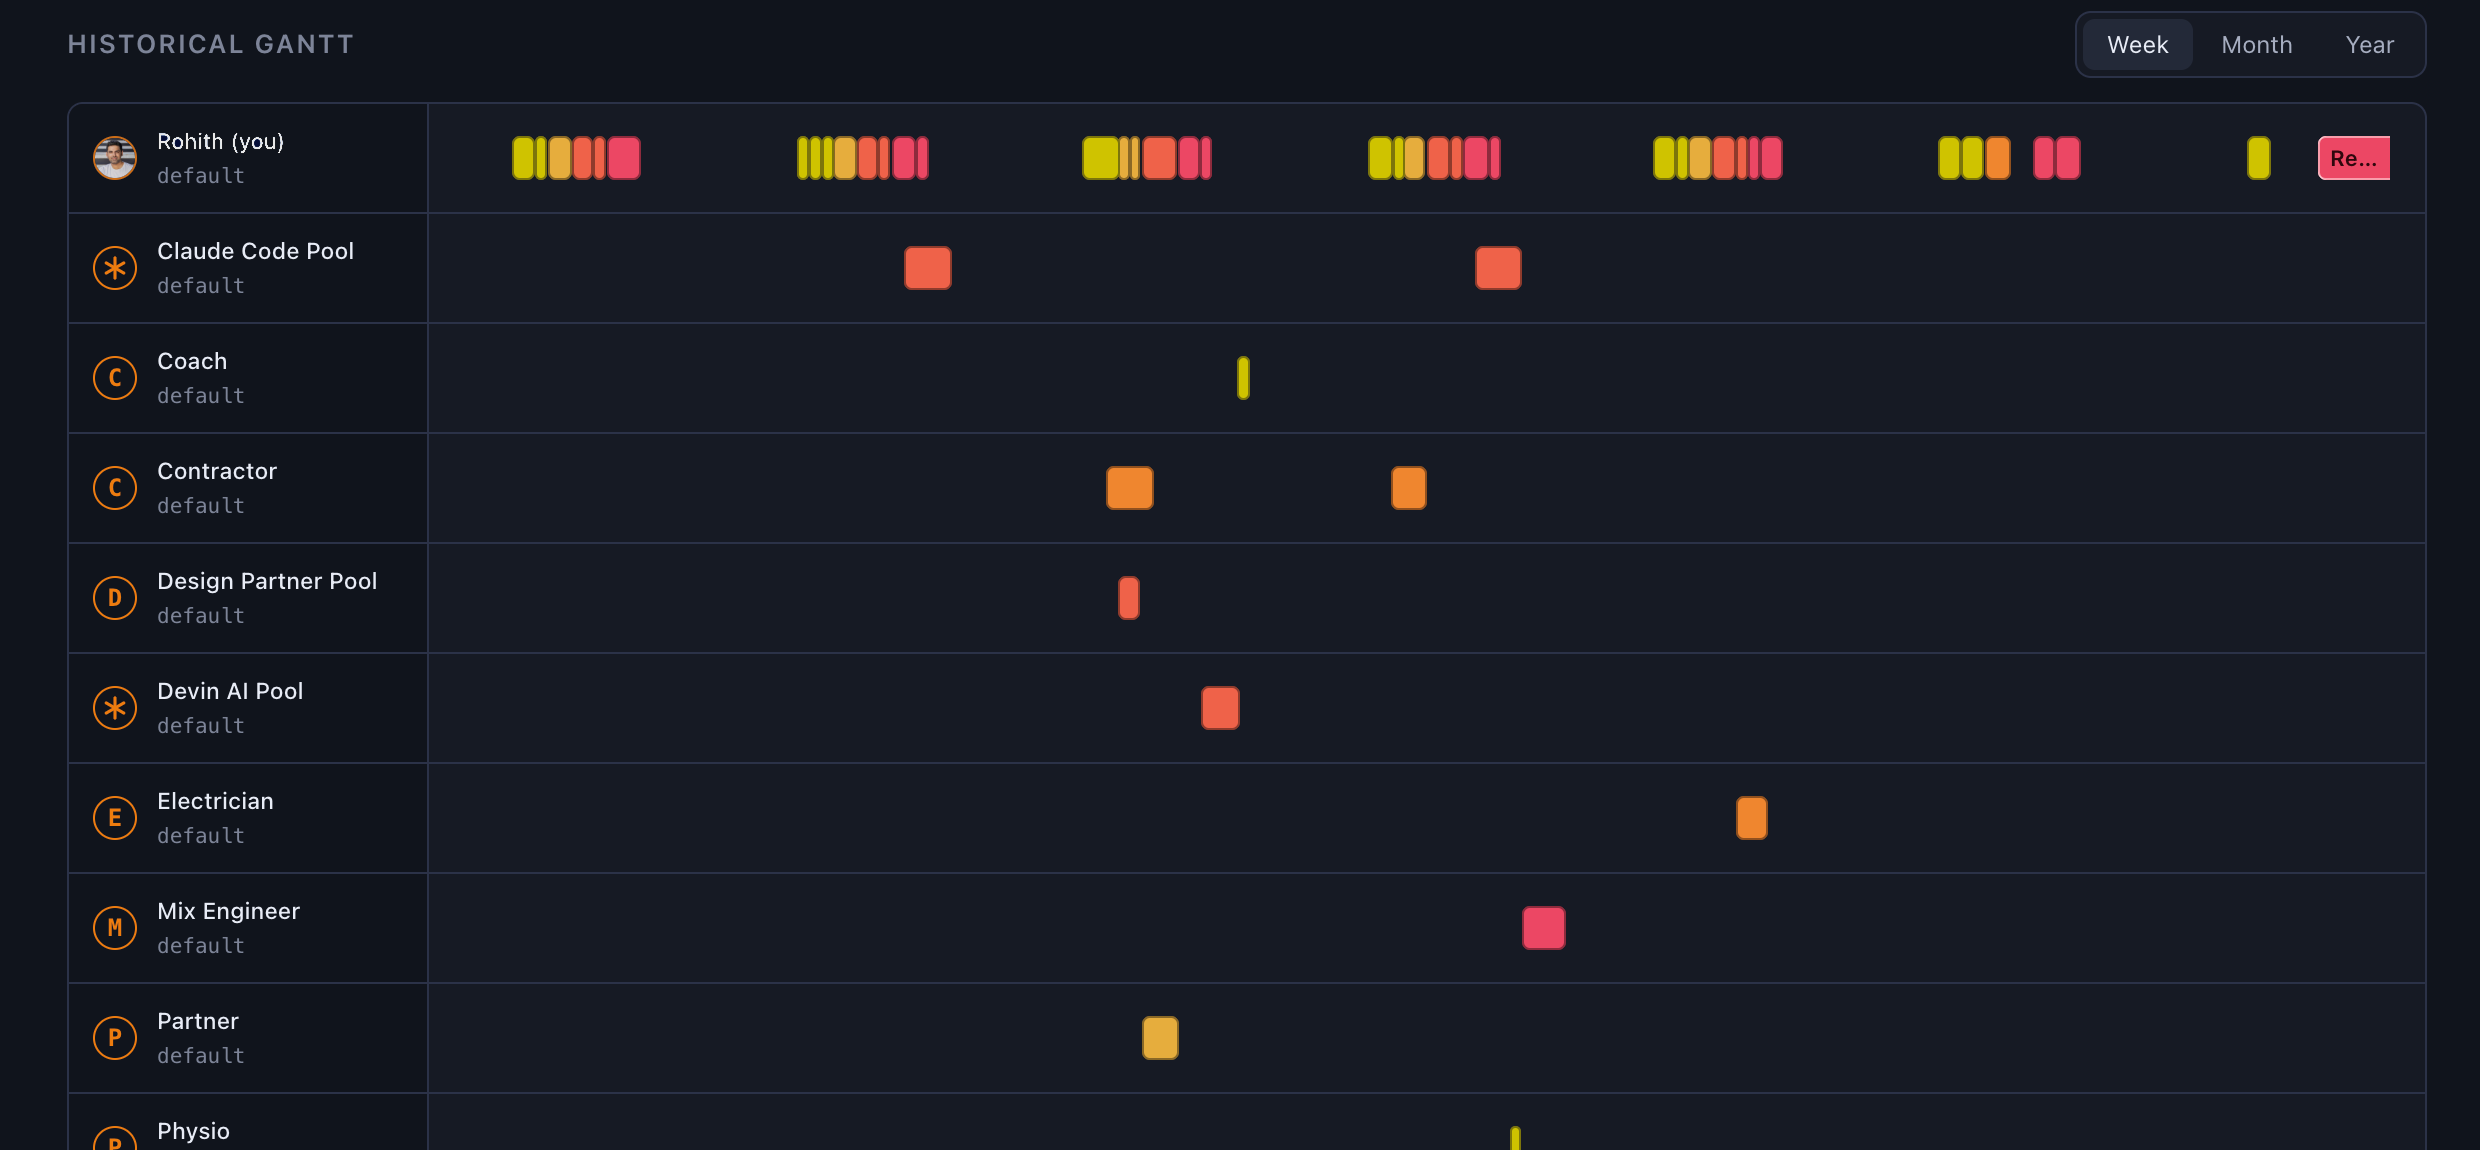
The same simulated schedule, projected onto people and time: one swim lane per person, tasks placed where the dependency order and each person's painted availability put them, hand-offs visible as work crossing lanes. This is the contributor's lens, and it answers the question roadmaps cannot: not "is the project on track?" but "what should I be doing on Thursday, and who is waiting on me?". The companion execute view is the same projection reduced to its sharpest form, the ready frontier: the tasks whose predecessors are done, right now, for you.
Money and Pareto: "can we afford it, and what should we choose?"#
The financial lenses ride the identical simulation: each sampled future replays the ledger, so the cash trajectory, drawdown, and P(insolvency) belong to the same futures the spectrum summarises. The Pareto tab goes one step further and sweeps the plan's declared decisions, rendering the frontier of non-dominated choices. Finance and strategy, reading the same object as everyone else.
The remaining lenses fill out the set: the graph canvas for structure, the source tab for the program itself, critical paths for where the schedule risk lives, parallelism for where the team is the bottleneck.
Why one object changes the meetings#
The practical consequences are blunt:
| With per-audience documents | With computed lenses |
|---|---|
| Status meetings reconcile the views | The views cannot disagree; the meeting discusses the plan |
| "Update the roadmap" is a recurring task | The roadmap re-renders on every edit and every completion |
| Each audience trusts its own artefact | Every audience cites the same object from its own angle |
| The IC's list and the exec's roadmap drift apart | Marking a task done moves both, instantly, mechanically |
The deeper benefit is the conversation quality. When the contributor's Thursday list and the executive's risk summary are provably projections of one source, disagreements stop being about whose document is stale and become about the actual content: the estimate, the dependency, the decision. The tool stops adjudicating versions and the team starts arguing about reality, which is the only argument worth having. (How completions ripple through every lens at once is its own story.)
One object. Many questions. Every lens just maths over the same source, which is why none of them is ever wrong about what the others know.